Predict House Prices with Python and Machine Learning (Beginner-Friendly Project)
Are you looking for a beginner-friendly machine learning project to improve your Python skills and boost your data science portfolio? You’re in the right place!
In this tutorial, we’ll walk through building a simple house price prediction model using Python, based on real-world housing data from California. You’ll learn how to:
- Load and explore a real dataset using Pandas
- Train a Linear Regression model using Scikit-learn
- Evaluate model performance with metrics like Mean Squared Error (MSE) and R² Score
- Visualize predicted vs actual house prices with matplotlib
The best part? The entire project is under 70 lines of code, making it a perfect starting point for anyone learning machine learning with Python.
Let’s dive in!
Before diving into machine learning, we first import the essential Python libraries. Pandas is used for data manipulation, matplotlib for plotting, and scikit-learn provides powerful tools for data splitting, model training, and performance evaluation.
These libraries are standard in almost every machine learning project, making this a perfect Python starter project for beginners.
import pandas
from sklearn.datasets import fetch_california_housing
from sklearn.model_selection import train_test_split
from sklearn.linear_model import LinearRegression
from sklearn.metrics import mean_squared_error, r2_score
import matplotlib.pyplot as plt
We use the California Housing dataset built into Scikit-learn. This dataset includes real housing data from California and is ideal for learning regression models.
By setting as_frame=True, we directly load the data as a pandas DataFrame, making it easier to visualize and manipulate.
# 1. Load the dataset
data = fetch_california_housing(as_frame=True)
df = data.frame
We split the dataset into:
- X (features): All columns except the target variable.
- y (target): The MedHouseVal column, which represents the median house value.
This step prepares our data for model training.
# 2. Separate features and target
X = df.drop('MedHouseVal', axis=1)
y = df['MedHouseVal']
Splitting the data into training and testing sets is a key step in any machine learning project. Here, 80% of the data is used to train the model, and 20% is reserved to evaluate how well the model performs on unseen data.
# 3. Split into training and test sets
X_train, X_test, y_train, y_test = train_test_split(X, y, test_size=0.2, random_state=42)
We train a Linear Regression model using the training data. This model tries to find the best-fitting straight line that predicts house prices based on input features like income, house age, and more.
# 4. Create and train the model
model = LinearRegression()
model.fit(X_train, y_train)
After training, the model is used to make predictions on the test set. This gives us estimated house prices that we’ll compare against actual values to see how accurate the model is.
# 5. Make predictions
y_pred = model.predict(X_test)
We evaluate the model using:
- Mean Squared Error (MSE): The average of the squares of the errors. Lower is better.
- R² Score: Explains how much variance in the target is explained by the features. Closer to 1 means better performance.
These metrics help us judge the accuracy of the model’s predictions.
# 6. Evaluate the results
mse = mean_squared_error(y_test, y_pred)
r2 = r2_score(y_test, y_pred)
print(f"Mean Squared Error (MSE): {mse:.2f}")
print(f"R2 Score: {r2:.2f}")
Finally, we visualize the results using a scatter plot. Ideally, if the predictions are perfect, all points would lie on a straight diagonal line. This graph helps us see how close the model’s predictions are to actual house prices.
# 7. Plot: Actual vs Predicted prices
plt.scatter(y_test, y_pred, alpha=0.5)

# Add axis labels and title
plt.xlabel("Actual Prices (in 100,000 USD)")
plt.ylabel("Predicted Prices (in 100,000 USD)")
plt.title("Actual vs Predicted House Prices (USD)")
plt.grid(True)

# Set the same scale for both axes (so the diagonal line looks correct)
min_val = min(min(y_test), min(y_pred))
max_val = max(max(y_test), max(y_pred))
plt.xlim(min_val, max_val)
plt.ylim(min_val, max_val)

# Draw a diagonal reference line (perfect prediction line)
plt.plot([min_val, max_val], [min_val, max_val], color='red', linestyle='--')

# Show the final plot
plt.show()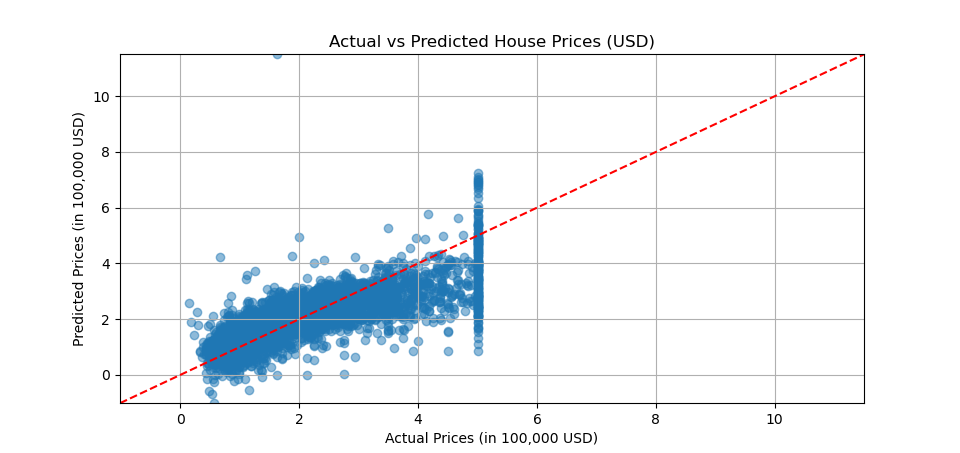
In under 70 lines of Python code, we’ve built a complete machine learning model to predict house prices using real California housing data. This is one of the best beginner-friendly machine learning projects and is excellent for your portfolio.
Try modifying it by using different regression models like Decision Trees or Random Forests to compare performance!
Feel free to reach out via email or connect with me on LinkedIn. I’ll do my best to get back to you as soon as possible.
Best Regards,
Can Ozgan